February 2010 Archives

Today's interactive graphic by Amanda Cox on the New York Times Olympics page mixes sound with visuals extremely effectively. 

olympic_medals_nyt.jpg
The visual distribution of the finishing times is pretty effective on its own, showing how close athletes are when most aren't racing simultaneously. But when you click "play" and hear the little synthesizer piano tick off the finishes, you can suddenly imagine lugers sailing across the finish line — at 90 mph, no less — in rapid succession. The added sound really drives home the closeness of many of these races and makes the graphic much more effective.
After the initial palaver over Apple's iPad announcement in January, gadget-watchers seem to be settling in to their opinions about what the device will actually be able to do. As they figure out what the iPad's capabilities are, I have a very specific question for the blogosphere: will I be able to write interactive multimedia books for this device?

ipad-sideview.jpg

In the keynote, Apple showed off its new bookstore, but e-readers for print are old news, and not particularly what I'm interested in. (Call me old-fashioned, but I'd rather read my Jane Austen on paper.)

A web designer over at Soro Book Design, Jeff Barry, has what I'm feeling nailed. Something new! Something fresh! Something that uses the capabilities of the device!

Barry has concluded that the only way to achieve that publishing vision is to develop an app, and after digging through press on the iPad, I'm inclined to agree. 

Apparently there's a non-disclosure agreement associated with downloading the iPad's developer kit, so it's tough to tell from the outside exactly what it's capable of (apart from the no Flash thing). But designing my own interactive book app sounds pretty wonderful.

How one funds such an endeavor, however, is another matter entirely. Somehow I doubt the App Store is going to pay my book advance.

Circles That Bounce

I had a go at Ben Fry's data sketchbook Processing. I made some circles.

This browser does not have a Java Plug-in.
Get the latest Java Plug-in here.


Not bad, huh? 

The weird Brownian-motion-style jiggling is because of the algorithm I made up to keep the circles from overlapping. It was only so successful. Still, a good first crack, methinks, for someone who didn't really know Java either.


Ben Fry at Columbia

Last night in the architecture school at Columbia University, data visualization expert Ben Fry addressed about a hundred architects and guests who, presumably, want to make data look good.

As I want to make data look good (and live only blocks away), I was among them.

benfry_image2.jpg
The image above is a tiny slice of All Streets, a piece that traces the continental US only by plotting its roads. Fry showed the piece last night, highlighting how the geography of the Appalachians stands out, even though no geographical data is explicitly included. 

He used All Streets and a number of other examples in an attempt to define "data visualization," by contrast with information graphics. Information graphics, in Fry's paradigm, are constructed by hand and contain tens to hundreds of data points. Data visualization, however, represents thousands or millions of points — far more than a designer can do by hand. Data visualization, therefore, depends on code.

Fry said he did All Streets, with its droves of data points, in an afternoon. He does have a Ph.D. from the Aesthetics + Computation group in MIT's Media Laboratory, though. Still, Fry said he harbors a dream of turning every designer into a programmer. To that end, he is working on his free data visualization software, Processing, to keep making it more appealing to designers. 

As an outsider who's approaching this field from the programming side, however, I won't need to wait.


Tracing a Dollar Bill

| 1 Comment
Perhaps you, like I, have dutifully copied a serial number from a one dollar bill bearing a red stamp into the database at wheresgeorge.com. And perhaps you, like I, thought as you did so: "Surely nothing can ever come of this. How many people are actually as fastidious as I am, saving one particular bill in their wallet until they are reunited with the Internet?"

It turns out we were wrong. Something did come of it.


This video just won first place in the noninteractive multimedia category of the 2009 visualization challenge, announced in the current issue of Science. The annual contest, sponsored by the National Science Foundation and AAAS, rewards beautiful photographs and art installations as well as visualization multimedia.

It's clear that this video was made by the scientists -- they don't shy away from using the jargon as a matter of principle. But it works. Because we're seeing the algorithms run as the narrator strings together words we don't understand, we're still able to get the essence of what they did. The video also has a strong voice and sense of humor, which sets it apart from many of the other, more educational winners. 

I'm an astronomer by training, and I love me some physical sciences. But in this brave new science journalism world I've entered, I suddenly find myself encountering biology terms like "epigenetic" and "gene expression," and I haven't taken biology since 1995. So I was grateful to find the web site Learn.Genetics, from the University of Utah. It was featured in the 29 January issue of Science as the first of 12 winners in their now-annual online educational resources contest.

cells_screenshot.jpg
The cell scale featured above is cool, but then, I've always been a sucker for Powers of Ten-esque visualizations.

What I really needed help with, though, was epigenetics. My understanding was that different genes kinda turn on and off in different cells at different times, but what causes it and what the actual, observable effects are remained a mystery. So I explored the epigenetics section.

From the introductory video, I gleaned that genes are wrapped around proteins. From the interactive gene control graphic, I learned that more tightly wound gene-protein strands turn genes "off" and thus release fewer protein signals. The page on identical twins taught me that epigenetic markers change over our entire lives, and the story of the baby rat put everything together for me, actually showing the effect of epigenetic changes on the long-term behavior of an animal.

So the information is definitely here, though like most biology teaching tools, the dual hurdles of jargon and process prove formidable. It would be nice if the gene control graphic showed what happens further down the line than the protein release, but I was able to synthesize that with the baby rat story on my own. They do a nice job, and the visualizations are actually helpful. I certainly understand epigenetics better as a result.
On her web site, Innovative Interactivity, Tracy Boyer reviews recent graphics, profiles big names in multimedia, and provides resources for people who, like myself, are just getting started in the field. Last week, she agreed to answer some of my questions about her project.

InnovativeInteractivity.jpg
How did you get started with visual journalism?
Looking back, I realize now that I actually got into multimedia back in high school when I was a part of a morning broadcast news program my sophomore year. I also created a bilingual documentary for my senior project teaching Hispanics how to do important tasks like get a driver's license, buy gas, etc. In college I tested out several majors, including astronomy and public relations before finally landing in multimedia after taking an "Intro to Flash" course with Laura Ruel. I fully credit Laura and that course for making me fall in love with the potential of visual journalism and interactive technology.
How did Innovative Interactivity get started?
I started blogging after attending the Poynter Summer Fellowship in 2007 where we were encouraged to get more involved in blogging and social media. At the time I was only on Facebook, and I thought it was impossible to find the time to bookmark the sites I visited on del.icio.us, write frequent blog posts, tweet interesting thoughts on Twitter, post my photos to Flickr, etc.  I remember being so overwhelmed that I started doing baby steps, first learning del.icios, then blogging on Blogger (with the clever blog title of "Tracy Boyer's blog"!), then tweeting. I'm still not using Flickr, Digg, StumbleUpon, and others, so you can see that I still have some baby steps to go!
What do you find is your most popular type of post?
It's really interesting to look at the analytics behind each post, because many times the posts that don't take as much time and thought are the ones that are the most popular. Anything with a number (10 must-see projects, 100 multimedia professionals...) always make a big ripple. Listing resources for different topics like my recent one with information visualization also seem to catch the attention of a lot of readers.
I love your tagline, "a digital watering hole for multimedia enthusiasts." How have you tried to nurture a community of readers?
Thanks! Honestly, I thought of that tagline while running one day because I wanted this site to be more of a collaborative forum than me preaching opinions. However, unfortunately the majority of time it's just me talking with little to no feedback. I know that people are reading because they are very gracious on a general level, but it normally takes a lot for people to actively comment on particular posts. One day a commenter made a great remark, but then e-mailed me quickly thereafter asking me to remove her comment when she realized that it was "featured" on the homepage in the list of recent comments. I wish I could have more of a discussion with my readers, and I will continually work towards that goal by asking more questions in my posts and bringing up controversial topics. But it's extremely hard to build an audience, so I'm proud of the community that II has built thus far.
Have you considered adding forums or other community attributes to the site, to foster the "watering hole" aspect?

I have seen several Ning sites in action with similar topics to that of II, and they always seem to dwindle. I'd rather not provide a forum that nobody uses, and instead wait until the community is large enough where I could anticipate good traffic to those types of components.
Do you do any promotion of your site, subtle or otherwise, on other multimedia journalism sites?

I do actively engage in dialogue with other bloggers, as well as promote II through word-of-mouth, talks, etc. It is a very delicate balance though between getting the word out about II and being obnoxious about it. I'm sure you will experience the same in promoting your blog!

Is Adobe Flash the only advertiser on your site? How did you get set up with them?
I use Commission Junction for my advertising purposes, which lets me pick my own advertisers. I currently have all Adobe ads, but I have used others in the past, including GoDaddy. I personally hate ads, so I try my best to make the ads relevant to the content on the site. Then I use Google ads on my RSS feeds. 
Is advertising your only source of revenue, or do you have other methods of financing the site?
You have to build a significant audience before you can get direct sponsors which brings in the real money. I make maybe $10 a month from my advertisements. Right now blogging isn't about making money, but rather building the community and audience so hopefully one day I can turn a profit. I always tell people that II has been (and is) a labor of love. 
What other projects are you involved with, besides Innovative Interactivity?
Each weekday morning I work on a news aggregation Web site called i360Gov. I am also part of UNC's News 21 project, where we are producing multimedia stories about energy issues for the site PoweringaNation.org. Then I have my master's thesis going on where I am researching the differences in short-tern retention rates and user satisfaction levels between passive and interactive multimedia.
What have you learned about the data visualization community from running this site?
I would say my audience is more interested in all forms of multimedia storytelling, with data visualization and graphics being one subset. It has been amazing to note the people I have "met" through blogging, and it is inspiring to hear their passionate ramblings about our field.

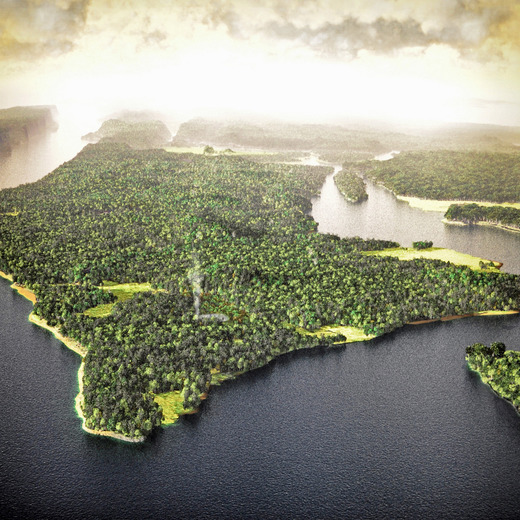
Yesterday was the four month anniversary of the closing of the Mannahatta exhibit at the Museum of the City of New York. Do I sound like I'm in mourning? I miss it.

mannahatta_helvetica.jpg[Credit: petit hibout, Flickr.com]

The exhibit deftly wove together three themes that have emerged in my own life and journalism: peeling back layers of history, a connection with nature in urban areas, and information display. 

There's a nice description of the display space at the web site of Pentagram, the firm that designed the exhibit.

Conceived and executed by Eric Sanderson at the Wildlife Conservation Society, the premise of Mannahatta is to peel back New York's history layers to reveal the island as it was when Henry Hudson sailed into the estuary in 1609. 

mannahatta_picture.jpg[Credit: Sharon Hahn Darlin, Flickr.com]

I toured the exhibit on a rainy Friday afternoon last October, on its very last day. 

At the center of the exhibit hall was a three-dimensional model of Manhattan island. Projectors above displayed maps onto the model, showing where streams once ran, where the Lenape camped, and where the beavers lived. And when I walked back across the northern reaches of Central Park, I could see it. 

Maybe it's just because I live in the uplands of Morningside Heights, but I think the key to the success of that map was its three-dimensionality. The Mannahatta web site hosts an interactive version (more on that another time), but it's just not as evocative. On the model, I could imagine myself at the crest of Morningside Park, looking across open plains. 

So many of our graphics are intended to be consumed on a flat surface. What becomes possible when we open up a third dimension? It's something I'm pondering.

Anyway. When I was at the museum, a tall man in a National Park Service uniform was taking measurements of the three-dimensional Mannahatta map, so I hold dear to the hope that it will resurface at some historic site someday soon.

Cracking a Master Lock

Cracking locks, busting safes, heisting diamonds from high-security vaults — it's every little girl's dream.

beautiful graphic promises to make those dreams come true. By the San Francisco designer Mark Campos, the illustration walks you through the technique for cracking a classic Master lock

And today, I tried it.

MasterLock1.jpg
I carefully opened the lock packaging and removed the sticker from the back without looking at it. With no prior knowledge of the answer, I began my quest for the combination.

The first step has me pull up on the handle to feel for the last number. It was awfully satisfying to feel the mechanism catch at some numbers and not others. From the twelve places the dial catches, the graphic provides the algorithm for knowing which number is the final digit in the combination. Mine was nine. The diamonds are nearly within my grasp now.


With the last number known, it comes down to working through all the permutations. Fortunately, prior knowledge of how Master locks work means there are only 100 possible combinations. Around attempt 50 or so, things were looking pretty bleak. I thought I might be spinning that dial for the rest of my life. Then I remembered that a crack thief needs to focus! So I focused. And on attempt 74, it gave:


Opening a lock whose combination I didn't know was damn cool. Even if someone else gave me the instructions.

MasterLock2.jpg
Beautiful infographic authenticated. Childhood dream accomplished. All in a day's work. 

I'm a regular Parker.

Usually, the goal of an infographic is to engage the viewer on an intimate level, to woo her into spending a good bit of time exploring the nuances of the data you're displaying. Can infographics be successful if they are consumed in a very superficial way? Yes. Look no further than the 2002 music video of "Remind Me," by the Norwegian band Röyksopp.


Even though each graphic is on the screen a short time, and some of them are clearly silly, many actually convey information in a fraction of a second. 

royksopp_watercycle.jpgroyksopp_commuter.jpgroyksopp_beer.jpg

The water cycle (0:47). Commuter transport (1:31). Beer consumption (3:51).

The successful graphics seem to work because they convey easy-to-understand information in a format that is familiar to the viewer. It's a nice reminder that reinventing the wheel sometimes only serves to obfuscate your meaning.
After working at Festoon Salon in Berkeley and San Francisco, Betty McCain founded her own company — Chop Salon in Berkeley, Calif. Yesterday, we had a conversation about her motivation and process.

chopsalon.jpg

How did you decide to strike out on your own and open your own salon?

I really wanted just to be my own boss. I thought about all the things I would need to get started, how much it would cost to do that, and how much income I needed to bring in to make it happen once I was working. I was very determined that I would be okay. Then I decided to take the risk.

How much of a pain was it to jump through the legal & permitting hoops?

It was ridiculous how many places and things you need to get going. There were permits to build, permits to say it is okay to build — one person says one thing, then another disagrees. And all the offices are in different parts of town and you need everyone to sign a form and pay more money. One time, they told me to get a signature and I ran all the way to this other building, and they told me they didn't need to sign. The communication is all wrong.

Another time, I was getting a special establishment license through the state. It would have taken two months to do it by mail. I drove to one office, paid it in cash — they didn't take check or credit — then had to drive to another office across town and bring the receipt to show I paid it, just to get things rolling faster. What a pain in the ass.

What were you looking for in the physical space you rented?

I wanted good lighting, big windows, and a high ceiling. Since it's a salon, I needed easy plumbing accessibility and new electrical with lots of outlets. I also wanted a good storefront, on a busy street, with okay parking, in a safe neighborhood. And I wanted to stay close to the area where I was used to seeing my clients.

I see on your web site that you have another stylist working with you. How did that partnership come about?

She found me when I opened and seems to be working out great. Although I had another girl for a while who didn't.

What have you done to find more business?

I have a web site, a Facebook page, a MySpace page, Yelp — I do client discounts, referrals, door-to-door flyering, parties, art shows, a fashion show...everything.

On the subject of art shows, can you tell me a little about your decision to pair with local artists and have a gallery space in your salon?

I have such big walls, and I always had this little dream of having art shows. I do it for two months at a time, and finding artists seems pretty easy. It's also a great way to promote the salon — when we have an opening for a new artist, new people come in that may never have known we were there.

Were you anxious about starting a business in a recession?

I just knew things would work out. I know it seems kind of funny, but I just had this feeling. I figured if I did it on a bare minimum need, meaning I didn't spend too much and go overboard on things — and my overhead is pretty low. I figure things can only get better, and so far they have been pretty good.

If you could do it all over again, what would you do differently?

I think everything went just about as smoothly as it could've. I might do something small, like different floors or different tables. As far as the business side of things, I am still taking things day by day and learning as I go.


About this site

    Katie Peek is a science writer and astronomer who is figuring out how to give voice to information and data. This web site is a log of her voyage.